Reporting
Reporting
Logging overview for important data.
The "Back to previous page" and "Refresh overview" icons are at the top of the screen.
You can filter according to the following criteria:
- Displayed topics: e.g. Cluster manager, Scheduler
- Time frame from / to
- Displayed notification levels: e.g. INFO, WARN, ERROR
The "Apply filter" button starts the reporting filter.
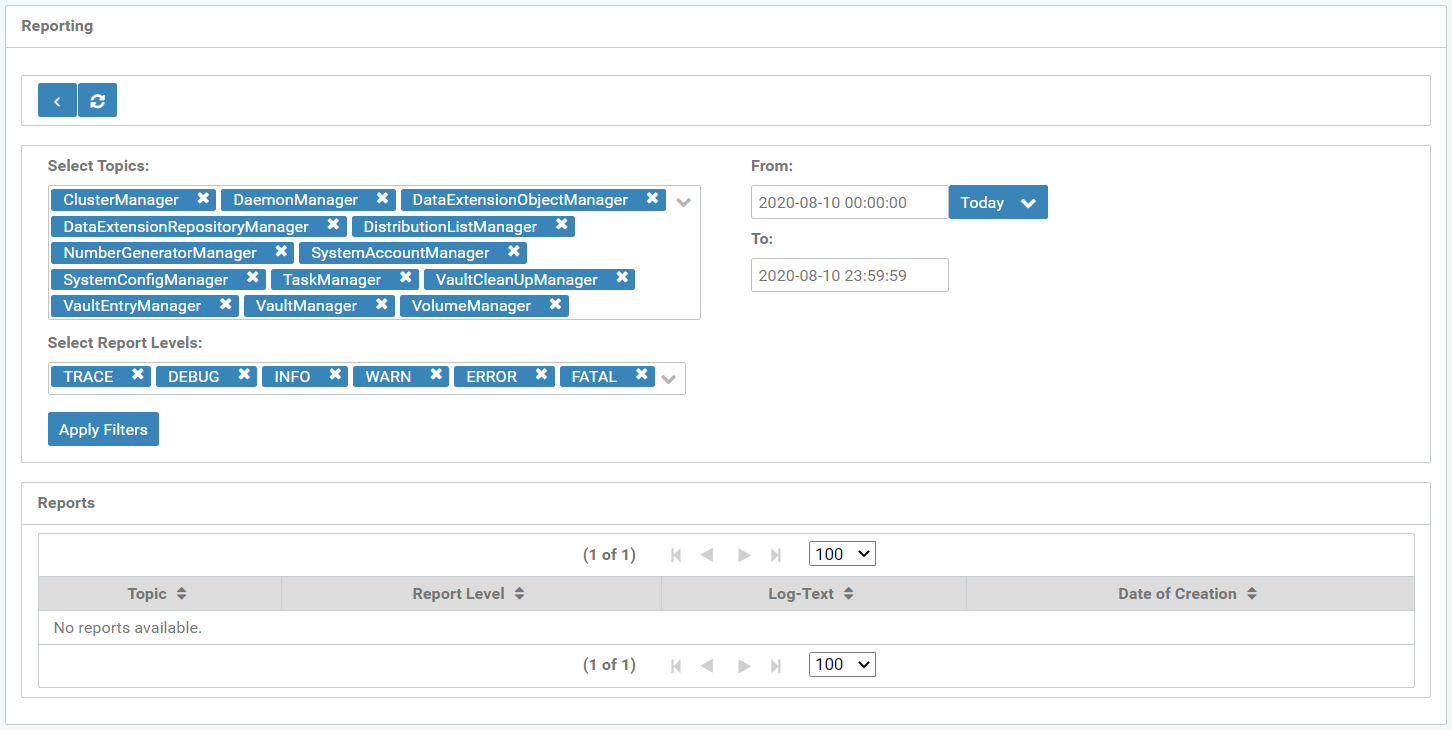
Figure: Monitoring - Reporting overview
Reports
Already created reports are displayed in a table
The columns are divided into
- Topic: e.g. SystemConfigManager
- Notification level: e.g. INFO
- Notification text (optional)
- Creation date
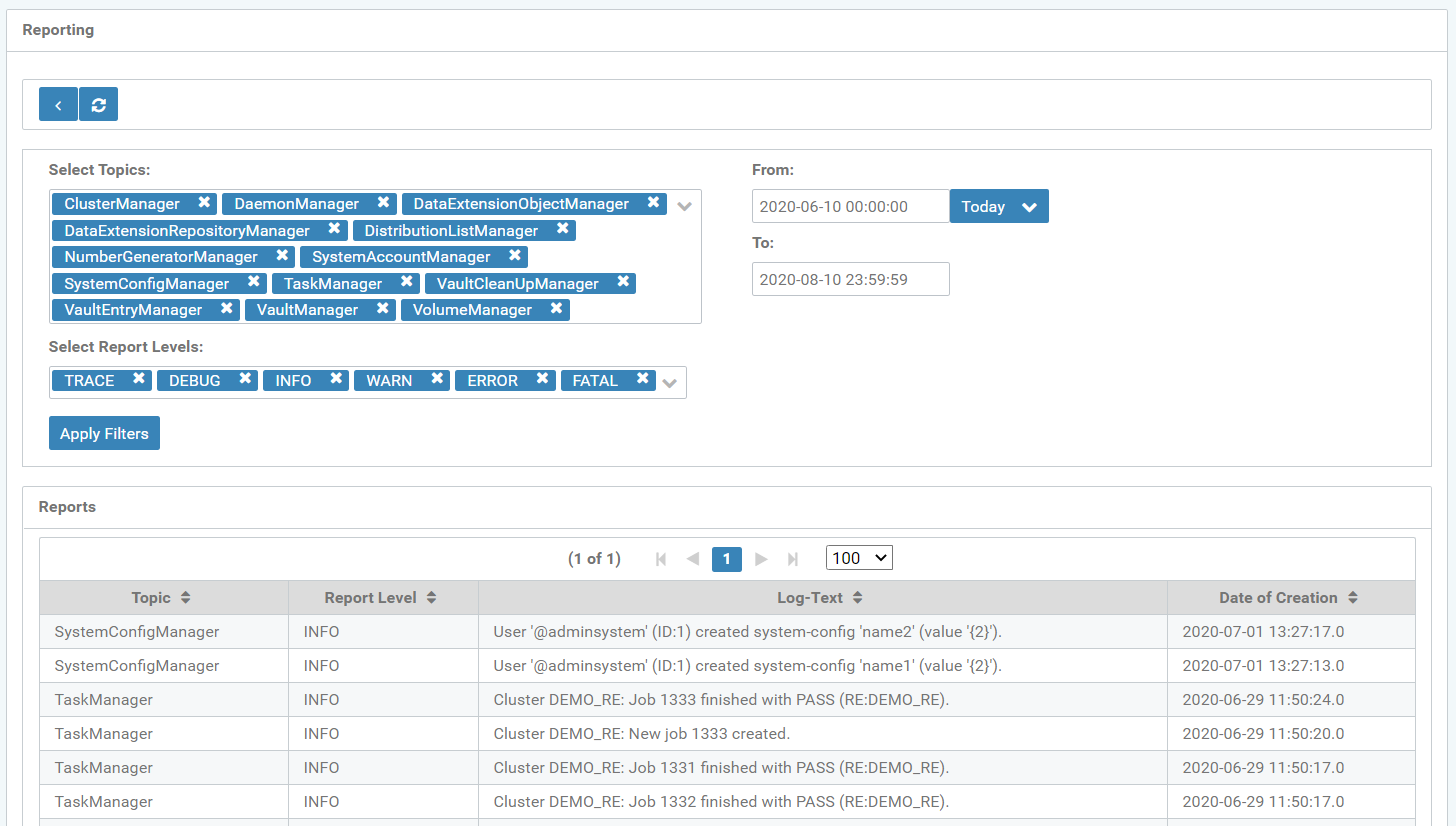
Figure: Monitoring - Reporting results
The table rows display in red, in case of an error message (ERROR).